Create professional structured charts quickly through simple conversations without any professional knowledge.
Get StartedC0 - Structured Charts from zero with chat.
Represents Chart / Concept / Conversation
The integration of structured charts, concepts, and conversations
Represents Starting point / Generation origin / Zero cost
Start from scratch
"From conversation to chart, generate visualization from zero"
c0 is the control register number
From 0 to Insight – Build structured charts through chat.
Simple Conversation
Describe your requirements in natural language
Intelligent Structuring
Automatically convert text into structured information
Professional Structured Chart
Generate high-quality structured information charts
Supports 9 different types of structured charts to meet various information visualization needs
Automatically saves all generated visualization charts for easy viewing and reuse
Supports Chinese and English interfaces to meet different users' language preferences
Provides multiple preset themes and color schemes, and also supports custom colors
Adjust the width ratio of the left and right panels by dragging the separator
Supports exporting the generated charts as PNG images or independent HTML files
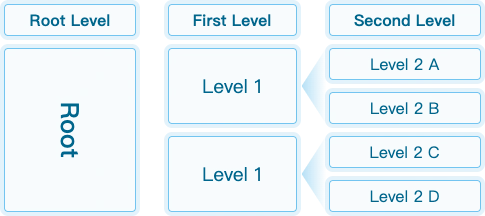
Visually display structured information with hierarchical relationships, such as organizational structures and file systems
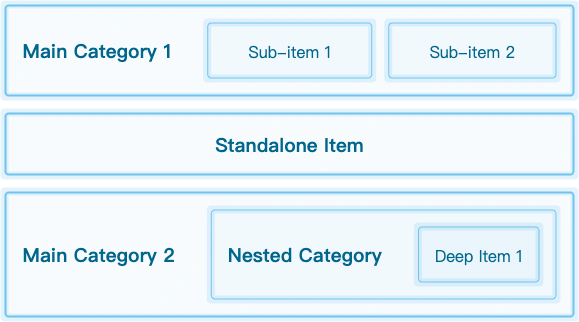
Visualize hierarchical structured data in a nested manner, perfectly presenting containment and attribution relationships

Display the thinking process and hierarchical relationships between concepts in a radial structure

Structurally display relational networks with direction but no cycles, such as flowcharts and dependency relationships
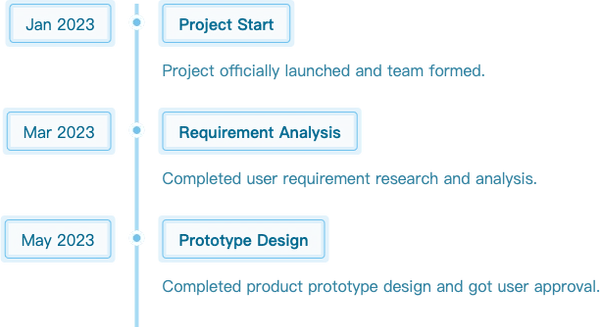
Structurally display event sequences in the time dimension, clearly presenting historical processes or project progress

Display the cross - relationships of multi - dimensional data in a structured table format for in - depth analysis
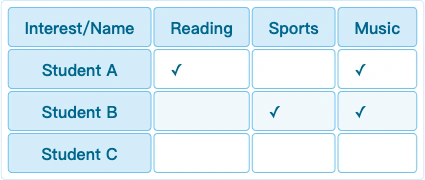
Visually display the association strength and connection patterns between entities in a matrix structure
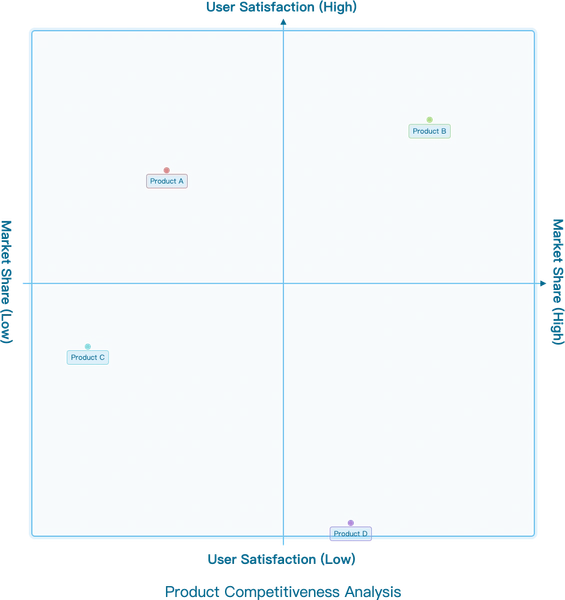
Structurally distribute information in four quadrants for priority analysis and strategic planning

Display the cause - effect relationships of problems in a fishbone structure, designed for root - cause analysis
Supports GitHub or Google accounts
Enter your requirements in the left panel
Choose from 9 chart types
Click the submit button to generate
Adjust colors, themes, or export
C0.chat is a tool that generates visualization charts through conversations. Users can quickly create professional chart visualizations with simple text descriptions, without programming knowledge. We support multiple chart types, including mind maps, hierarchy charts, timelines, fishbone diagrams, etc.
C0.chat supports exporting the generated charts as PNG images or independent HTML files. After the chart is generated, click the "Export as PNG" or "Export as HTML" button in the bottom - right corner. The exported files can be used for presentations, reports, or shared with others.
Yes, C0.chat provides multiple customization options. You can change the chart's theme, color scheme, etc.
C0.chat attaches great importance to user data security. We use encryption technology to protect your data transmission and storage. We will not use your data for model training or share it with third parties. You can delete your account and related data at any time. Please refer to our privacy policy for detailed information.
C0.chat supports various modern browsers, including Chrome, Edge, etc. For the best experience, we recommend using the latest version of the browser.
All charts created by logged - in users will be automatically saved to your account. You can view, edit, or delete these charts on the "My Charts" page.
Log in now and start creating professional structured charts without any professional knowledge
Log in